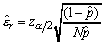
 is small
enough, it means that the difference appeared when replacing p
by
is small
enough, it means that the difference appeared when replacing p
by 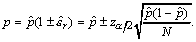
A more accurate value for the confidence interval of the estimated probability, [7], is:
p1< p < p2,
where:
In this case too, we can say that
the true value p will lie within the interval (p1,
p2) with a confidence level of (1-α),
i.e. in 100(1-α)% of cases.
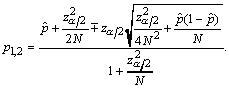
Observation:
If N is large, it appears from relation (6) that the three
terms involving
On the other hand, we can predetermine
the N volume of the experimental data so that we can obtain
the desired accuracy of the confidence interval (N results
from relations (4)). Therefore calculations can be resumed in
several iterations.
For all probabilities (of p(i), p(j/i) and p(i,j) type)
the estimate values are given
together with their corresponding relative errors calculated for
an α significance level of 0.05. That leads to a 95% confidence
interval for the respective probabilities, whose upper and lower
limits can be directly written as shown in Section 3, relation(5).
The estimates are filled in Tables
2.x - 4.x, where x=1 or 2, according to the cases without or with
blanks. (Blanks are denoted by the sign "-".)
Condition Np(1-p) >> 1
(required by de Moivre-Laplace approximation to
the binomial distribution) was each time checked up; concretely
all estimates verified that N
We have considered only cases
when signal to noise ratio was greater than 20 (equivalently,
relative error &vepsilon;r < 0.1).
We give now some more explanations referring to Tables 1-4.
A) Conditional probabilities, p(j/i) 47
 are negligible
compared to the other terms; this leads to relation (5). For example, in
our illustrations where =1.96 and
N
are negligible
compared to the other terms; this leads to relation (5). For example, in
our illustrations where =1.96 and
N (1-)
> 20, relation (5) can be used in order to obtain the upper
and lower confidence limits for p.
(1-)
> 20, relation (5) can be used in order to obtain the upper
and lower confidence limits for p.
4. Experimental results
Text
Without blank
X - printed Romanian
12,672,756
15,122,431
Y - first-order Markov chain
55,004
65,330
Y1 for marker-letter E
6,716
6,699
Y1 for marker-letter P
1,660
1,729
Y1 for marker-letter
654
652
(1-) > 20.
Results concerning conditional
probabilities estimation are given in the first four columns of
Tables 3.1 and 3.2; these were obtained on the basis of our method
described in Section 2 with a choice of the s parameter
as 200 letter (s = 200, Fig. 1). That means that the sample
data (the N observations required for probability estimation)
consisted of the N letters text emitted by Y1
source, as shown in Fig. 2. These data comply with the i.i.d.
statistical model and consequently we can use relations (4)-(6)
for an error control of probability calculation.